Creating Infographics with Adobe Illustrator: Volume 2: 2D and 3D Graphics
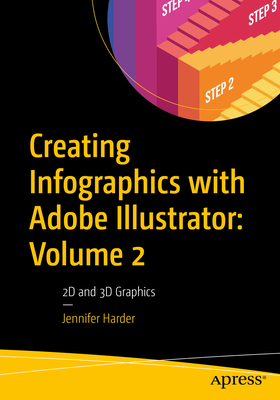
Creating Infographics with Adobe Illustrator: Volume 2: 2D and 3D Graphics
This full-color book will teach you how to use Adobe Illustrator's various tools to create infographics, as well as basic page layouts for them. It focuses on Illustrator's powerful graphing tools and 2D and 3D effects.
How can an infographic or graph be altered and adapted to appear more engaging and still display your data accurately? What additional effects can be used on your infographic to produce the results you envision? In this second volume of Creating Infographics with Adobe Illustrator, you will learn the answers to all these questions. Author Jennifer Harder will walk you through creating basic infographics in Illustrator using Illustrator tools such as Graphing Tools as well as how to create 2D effects and 3D shapes with their related materials, including Symbols.
Upon completing this volume, you will have an appreciation for how easy it is to design an infographic or graph to display your data and discover how rudimentary shapes and colors can be altered using patterns, as well as 2D and 3D effects, to enhance readability while conveying meaning to your audience. You will be able to use this knowledge to create your own infographics using Illustrator's wide array of tools.
What You Will Learn
- Use Illustrator's Graphing Tools to create and modify basic charts or graphs
- Work with popular 2D effects to enhance your design in Illustrator
- Create 3D Shapes using Materials and Symbols and modify your 3D Graphs
- Explore basic Image Trace and Perspective options in Illustrator
Who This Book Is For
Beginner-level designers and others who are interested in learning the process of creating infographics for their company, the classroom, for data visualization, an article in a magazine, or a webpage.PRP: 340.94 Lei
Acesta este Pretul Recomandat de Producator. Pretul de vanzare al produsului este afisat mai jos.
306.85Lei
306.85Lei
340.94 LeiLivrare in 2-4 saptamani
Descrierea produsului
This full-color book will teach you how to use Adobe Illustrator's various tools to create infographics, as well as basic page layouts for them. It focuses on Illustrator's powerful graphing tools and 2D and 3D effects.
How can an infographic or graph be altered and adapted to appear more engaging and still display your data accurately? What additional effects can be used on your infographic to produce the results you envision? In this second volume of Creating Infographics with Adobe Illustrator, you will learn the answers to all these questions. Author Jennifer Harder will walk you through creating basic infographics in Illustrator using Illustrator tools such as Graphing Tools as well as how to create 2D effects and 3D shapes with their related materials, including Symbols.
Upon completing this volume, you will have an appreciation for how easy it is to design an infographic or graph to display your data and discover how rudimentary shapes and colors can be altered using patterns, as well as 2D and 3D effects, to enhance readability while conveying meaning to your audience. You will be able to use this knowledge to create your own infographics using Illustrator's wide array of tools.
What You Will Learn
- Use Illustrator's Graphing Tools to create and modify basic charts or graphs
- Work with popular 2D effects to enhance your design in Illustrator
- Create 3D Shapes using Materials and Symbols and modify your 3D Graphs
- Explore basic Image Trace and Perspective options in Illustrator
Who This Book Is For
Beginner-level designers and others who are interested in learning the process of creating infographics for their company, the classroom, for data visualization, an article in a magazine, or a webpage.Detaliile produsului


