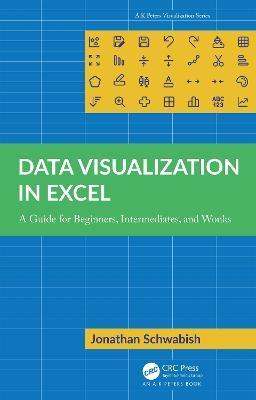
Data Visualization in Excel: A Guide for Beginners, Intermediates, and Wonks

Data Visualization in Excel: A Guide for Beginners, Intermediates, and Wonks
This book closes the gap between what people think Excel can do and what they can achieve in the tool. Over the past few years, recognition of the importance of effectively visualizing data has led to an explosion of data analysis and visualization software tools. But for many people, Microsoft Excel continues to be the workhorse for their data visualization needs, not to mention the only tool that many data workers have access to. Although Excel is not a specialist data visualization platform, it does have strong capabilities. The default chart types do not need to be the limit of the tool's data visualization capabilities, and users can extend its features by understanding some key elements and strategies. Data Visualization in Excel provides a step-by-step guide to creating more advanced and often more effective data visualizations in Excel and is the perfect guide for anyone who wants to create better, more effective, and more engaging data visualizations.
PRP: 259.10 Lei
Acesta este Prețul Recomandat de Producător. Prețul de vânzare al produsului este afișat mai jos.
233.19Lei
233.19Lei
259.10 LeiLivrare in 2-4 saptamani
Descrierea produsului
This book closes the gap between what people think Excel can do and what they can achieve in the tool. Over the past few years, recognition of the importance of effectively visualizing data has led to an explosion of data analysis and visualization software tools. But for many people, Microsoft Excel continues to be the workhorse for their data visualization needs, not to mention the only tool that many data workers have access to. Although Excel is not a specialist data visualization platform, it does have strong capabilities. The default chart types do not need to be the limit of the tool's data visualization capabilities, and users can extend its features by understanding some key elements and strategies. Data Visualization in Excel provides a step-by-step guide to creating more advanced and often more effective data visualizations in Excel and is the perfect guide for anyone who wants to create better, more effective, and more engaging data visualizations.
Detaliile produsului


