


Graphical Data Analysis with R
Graphical Data Analysis with R
See How Graphics Reveal Information
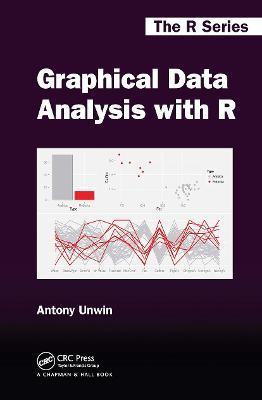
Graphical Data Analysis with R shows you what information you can gain from graphical displays. The book focuses on why you draw graphics to display data and which graphics to draw (and uses R to do so). All the datasets are available in R or one of its packages and the R code is available at rosuda.org/GDA.
Graphical data analysis is useful for data cleaning, exploring data structure, detecting outliers and unusual groups, identifying trends and clusters, spotting local patterns, evaluating modelling output, and presenting results. This book guides you in choosing graphics and understanding what information you can glean from them. It can be used as a primary text in a graphical data analysis course or as a supplement in a statistics course. Colour graphics are used throughout.
PRP: 416.98 Lei
Acesta este Pretul Recomandat de Producator. Pretul de vanzare al produsului este afisat mai jos.
375.28Lei
375.28Lei
416.98 LeiPrimesti 375 puncte

Livrare in 2-4 saptamani
Descrierea produsului
See How Graphics Reveal Information
Graphical Data Analysis with R shows you what information you can gain from graphical displays. The book focuses on why you draw graphics to display data and which graphics to draw (and uses R to do so). All the datasets are available in R or one of its packages and the R code is available at rosuda.org/GDA.
Graphical data analysis is useful for data cleaning, exploring data structure, detecting outliers and unusual groups, identifying trends and clusters, spotting local patterns, evaluating modelling output, and presenting results. This book guides you in choosing graphics and understanding what information you can glean from them. It can be used as a primary text in a graphical data analysis course or as a supplement in a statistics course. Colour graphics are used throughout.
Detaliile produsului
S-ar putea sa-ti placa si
-
PRP: 465.52 Lei
418.97 Lei
418.97 Lei465.52 Lei
-
PRP: 367.12 Lei
330.41 Lei
330.41 Lei367.12 Lei
-

PRP: 543.91 Lei
489.52 Lei
489.52 Lei543.91 Lei
-

PRP: 79.29 Lei
71.36 Lei
71.36 Lei79.29 Lei
-
PRP: 275.49 Lei
247.94 Lei
247.94 Lei275.49 Lei
-

PRP: 198.83 Lei
178.95 Lei
178.95 Lei198.83 Lei
-
PRP: 471.47 Lei
424.32 Lei
424.32 Lei471.47 Lei
-
PRP: 305.78 Lei
275.20 Lei
275.20 Lei305.78 Lei
-

PRP: 142.29 Lei
128.06 Lei
128.06 Lei142.29 Lei
-

PRP: 240.18 Lei
216.16 Lei
216.16 Lei240.18 Lei
-

PRP: 117.49 Lei
105.74 Lei
105.74 Lei117.49 Lei
-

PRP: 177.86 Lei
160.07 Lei
160.07 Lei177.86 Lei
-

PRP: 306.90 Lei
276.21 Lei
276.21 Lei306.90 Lei
-
PRP: 178.25 Lei
160.43 Lei
160.43 Lei178.25 Lei
-
PRP: 244.72 Lei
220.25 Lei
220.25 Lei244.72 Lei
-
PRP: 212.50 Lei
191.25 Lei
191.25 Lei212.50 Lei
-

PRP: 117.49 Lei
105.74 Lei
105.74 Lei117.49 Lei

De acelasi autor
-

PRP: 534.84 Lei
481.36 Lei
481.36 Lei534.84 Lei


