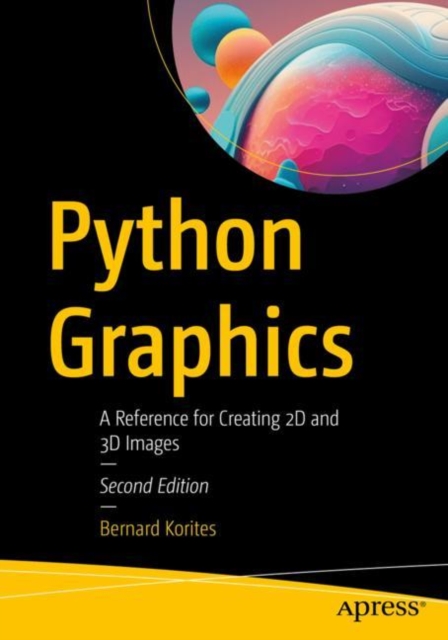
Python Graphics: A Reference for Creating 2D and 3D Images

Python Graphics: A Reference for Creating 2D and 3D Images
This book shows how to use Python's built-in graphics primitives - points, lines, and arrows - to create complex graphics for the visualization of two- and three-dimensional objects, data sets, and technical illustrations.
This updated edition provides more detailed explanations where required, especially regarding Python code, and explores scientific applications to topics of contemporary importance. You'll learn how to create any 2D or 3D object or illustration, as well as how to display images, use color, translate, rotate, shade, add shadows that are cast on other objects, remove hidden lines, plot 2D and 3D data, fit lines and curves to data sets, display points of intersection between 2D and 3D objects, and create digital art. Demonstrations are included which illustrate graphics programming techniques by example, the best way to learn a language.Also brand new to this edition are demonstrations on how to visualize electron probability clouds around a nucleus, climate change, ecological diversity, population dynamics, and resource management. Python source code, including detailed explanations, is included for all applications, making the book more accessible to novice Python programmers.
After completing this book, you will be able to create compelling graphic images without being limited to functions available in existing Python libraries.
What You Will Learn
- Create 2D and 3D graphic images
- Add text and symbols to images
- Shade 3D objects
- Display cast shadows
- Use color for maximum effect
- View 2D and 3D data sets
- Fit lines and curves to data sets
Who This Book Is For
Python developers, scientists, engineers, and students who use Python to produce technical illustrations and display and analyze data sets. Assumes familiarity with vectors, matrices, geometry and trigonometry.PRP: 340.94 Lei
Acesta este Prețul Recomandat de Producător. Prețul de vânzare al produsului este afișat mai jos.
272.75Lei
272.75Lei
340.94 LeiLivrare in 2-4 saptamani
Descrierea produsului
This book shows how to use Python's built-in graphics primitives - points, lines, and arrows - to create complex graphics for the visualization of two- and three-dimensional objects, data sets, and technical illustrations.
This updated edition provides more detailed explanations where required, especially regarding Python code, and explores scientific applications to topics of contemporary importance. You'll learn how to create any 2D or 3D object or illustration, as well as how to display images, use color, translate, rotate, shade, add shadows that are cast on other objects, remove hidden lines, plot 2D and 3D data, fit lines and curves to data sets, display points of intersection between 2D and 3D objects, and create digital art. Demonstrations are included which illustrate graphics programming techniques by example, the best way to learn a language.Also brand new to this edition are demonstrations on how to visualize electron probability clouds around a nucleus, climate change, ecological diversity, population dynamics, and resource management. Python source code, including detailed explanations, is included for all applications, making the book more accessible to novice Python programmers.
After completing this book, you will be able to create compelling graphic images without being limited to functions available in existing Python libraries.
What You Will Learn
- Create 2D and 3D graphic images
- Add text and symbols to images
- Shade 3D objects
- Display cast shadows
- Use color for maximum effect
- View 2D and 3D data sets
- Fit lines and curves to data sets
Who This Book Is For
Python developers, scientists, engineers, and students who use Python to produce technical illustrations and display and analyze data sets. Assumes familiarity with vectors, matrices, geometry and trigonometry.Detaliile produsului


