


Excel Pivot Tables & Introduction To Dashboards The Step-By-Step Guide
Excel Pivot Tables & Introduction To Dashboards The Step-By-Step Guide
Learn how to create Pivot Tables quickly and easily with this step-by-step guide!
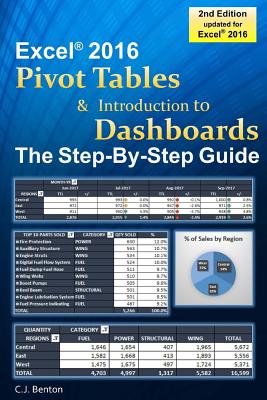
Updated for Microsoft(R) Excel(R) 2016! This book provides easy to follow step-by-step examples with screenshots demonstrating how to create Pivot Tables and basic Dashboards.
- Organize and summarize data
- Format & filter Pivot Table results
- Create Pivot Charts
- Display averages & percentages
- Group data into predefined ranges
- Use Slicers
- Rank results
- Apply calculated fields
- Create Pivot Table reports from imported files
- And more!
In addition to the above, you will also learn how to create, format, and update a basic Dashboard using Pivot Table data. Including how to incorporate charts and performance symbols into your reporting.
A great resource for:- Business Analysts
- Data Analysts
- Financial Analysts
- Administrative and Support staff
Imagine the time you'll save by not having to search the internet or help files to learn the most practical ways of using one of Microsoft(R) Excel's(R) best features!
PRP: 100.67 Lei
Acesta este Pretul Recomandat de Producator. Pretul de vanzare al produsului este afisat mai jos.
90.60Lei
90.60Lei
100.67 LeiPrimesti 90 puncte

Livrare in 2-4 saptamani
Descrierea produsului
Learn how to create Pivot Tables quickly and easily with this step-by-step guide!
Updated for Microsoft(R) Excel(R) 2016! This book provides easy to follow step-by-step examples with screenshots demonstrating how to create Pivot Tables and basic Dashboards.
- Organize and summarize data
- Format & filter Pivot Table results
- Create Pivot Charts
- Display averages & percentages
- Group data into predefined ranges
- Use Slicers
- Rank results
- Apply calculated fields
- Create Pivot Table reports from imported files
- And more!
In addition to the above, you will also learn how to create, format, and update a basic Dashboard using Pivot Table data. Including how to incorporate charts and performance symbols into your reporting.
A great resource for:- Business Analysts
- Data Analysts
- Financial Analysts
- Administrative and Support staff
Imagine the time you'll save by not having to search the internet or help files to learn the most practical ways of using one of Microsoft(R) Excel's(R) best features!
Detaliile produsului
S-ar putea sa-ti placa si
-
PRP: 207.33 Lei
186.60 Lei
186.60 Lei207.33 Lei
-
PRP: 304.12 Lei
273.71 Lei
273.71 Lei304.12 Lei
-
PRP: 309.94 Lei
278.95 Lei
278.95 Lei309.94 Lei
-
PRP: 247.94 Lei
223.15 Lei
223.15 Lei247.94 Lei
-
PRP: 306.00 Lei
275.40 Lei
275.40 Lei306.00 Lei
-
PRP: 247.94 Lei
223.15 Lei
223.15 Lei247.94 Lei
-
PRP: 156.33 Lei
140.70 Lei
140.70 Lei156.33 Lei
-
PRP: 198.09 Lei
178.28 Lei
178.28 Lei198.09 Lei
-
PRP: 216.94 Lei
195.25 Lei
195.25 Lei216.94 Lei
-
PRP: 69.75 Lei
62.77 Lei
62.77 Lei69.75 Lei
-
PRP: 123.59 Lei
111.23 Lei
111.23 Lei123.59 Lei
-
PRP: 203.87 Lei
183.48 Lei
183.48 Lei203.87 Lei
-

PRP: 54.17 Lei
48.75 Lei
48.75 Lei54.17 Lei
-

PRP: 247.94 Lei
223.15 Lei
223.15 Lei247.94 Lei
-
PRP: 322.32 Lei
290.09 Lei
290.09 Lei322.32 Lei
-

PRP: 439.08 Lei
395.17 Lei
395.17 Lei439.08 Lei
-
PRP: 340.94 Lei
306.85 Lei
306.85 Lei340.94 Lei
De acelasi autor
-

PRP: 139.42 Lei
125.48 Lei
125.48 Lei139.42 Lei
-
PRP: 69.67 Lei
62.70 Lei
62.70 Lei69.67 Lei
-
PRP: 92.92 Lei
83.63 Lei
83.63 Lei92.92 Lei


